

It’s just a tidal wave of information and people get scared away. But fear not, in this post, we cover off some of the most important sections of Google Analytics and what these important metrics mean for your business.
.01 Audience
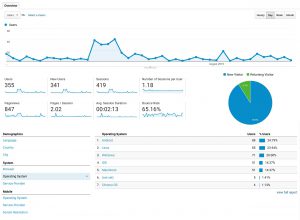
The overview section within Audience>Overview is the best snapshot you can obtain about your website and how users behave on it.
Here you can find out:
- Users – Amount of unique users who visit your website
- New Users – New users for this reporting period
- Sessions – Amount of times users have been to your website
- Number of Session per user – The average amount of visits per user
- Pageviews – Quite self-explanatory
- Page/Session – How many pages on average users are visiting per session
- Avg Session Duration – How long they are spending on the website
- Bounce Rate – Users who leave the website from the same page they entered.
The above stats can paint a picture if analysed correctly. For example, bounce rates should typically be around 50%, are users finding the website difficult to use? are they finding the information they require? but keep in mind, this particular website has it’s phone number on the homepage, and most customers would prefer to call this business, so users may still be getting the information they require (in this case a phone number) and closing the website.
You can also see how many pages people are visiting, is the navigation clunky or hard to navigate rendering in low page views per session and bounce?
The section below this also covers Language, Country and most importantly, Operating Systems.
As seen in the example above, this website is mostly viewed on Android Devices, so it is detrimental that this website is not just responsive but UX friendly for the user on those devices.
.02 Acquisition
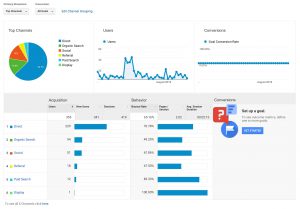
Let’s talk about how we acquired the visitors above.
The Overview within the acquisition section of the website explains how users arrived on your website, whether that was via Google, directly typing in the URL or form Social media. The options we have are:
- Direct – Someone typing your URL directly into their browser
- Organic Search – Someone finding you on Google
- Social – A link on social media (Facebook, Instagram, Twitter, etc)
- Referral – A link on someone else’s website
- Paid Search – A click on a paid Google Advert
- Display – A link clicked within Googles Display Network
The overview page demonstrates a few key parts for each referral source such as the number of users, sessions, bounce rate and session duration.
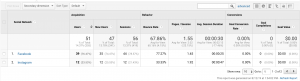
If you click on one of these sources, it will drill down further, for example, On social media, it will give the above stats based on each individual Social Network, plus a little more if you have conversions set up (that’s another whole post).
.03 Behaviour
Last but not least, what are people doing exactly once they are on your website. We now know how many, and where from, but what pages exactly are they visiting and what content are they taking in?
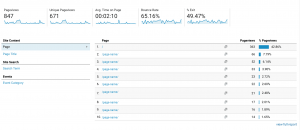
First up we get a little bit of a repeat of the same information on the Audience Overview. The gold is just below that, there is a table outlining your most visited pages. Probably wondering why / is receiving all the traffic, this is how Google Analytics represents your Home Page. There is also an option to set it to Page title, which may be a little easier on the eyes.
Within this section, you can also drill down further, for example to Behaviour > Site Content > All pages.
In this section, you can look at bounce rates of individual pages, Time on page, Entries & Exits.
The above will help any website owner begin to decipher if their website is truly performing. Whilst there are large amounts of collected data, knowing how to understand the basics will assist in making business decisions moving forward.